1 An Introduction to Remote Sensing
1.1 Summary
1.1.1 Sensor
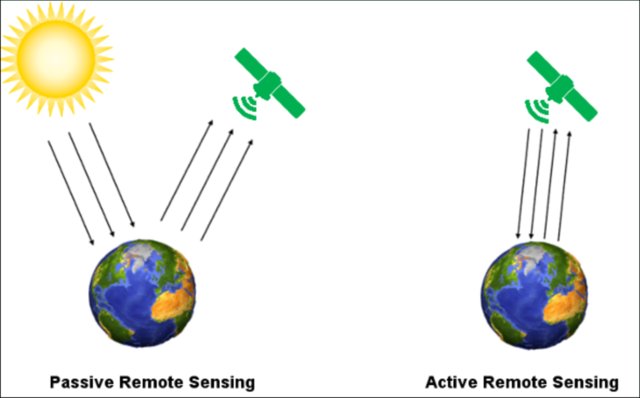
There are two types of sensor which are active and passive sensors.
Source:Fernanda Lopez Ornelas, 2016
- Active Sensor
Summary: Active sensors emit their own energy source for illumination and measure the reflection or scattering of this energy by the targets on the Earth’s surface. The examples of active sensors include radar, X-ray, LiDAR
Pros: They can penetrate to certain materials like cloud, vegetation and soil, which will enable subsurface imaging. Moreover, They are independent to solar illumination, so it is allowing for day and night data collection.
Cons: The main drawback is its sensitive to the surface roughness and orientation of the target. It also requires more power to operate, which will limit the sensor’s lifetime.
- Passive Sensor
Summary: Passive sensors detect the natural energy emitted or reflected by the Earth’s surface.It do not emit anything, like active sensors. The examples of passive sensors include human eye, camera, satellite sensor
Pros: These sensors provide information on a wide range of spectral bands, allowing for detailed analysis of vegetation, water quality, and atmospheric conditions. Furthermore, high spatial and spectral resolution data can be provided.
Cons: The performance of passive sensors can be affected by solar illumination and atmospheric conditions. Therefore, if the sky is not clear, it could be the problems to this kind of sensor. Also, it cannot penetrate through clouds, smoke, or vegetation like active sensors.
1.1.2 Remotely sensed data
- Most common data format is raster. Common file types include BIL, BSQ, BIP and GeoTIFF.
- Resolutions of data are considered in many aspects, including spatial, spectral, temporal and radiometric. The explanation and examples of each resolution are following:
| Resolution | Description | Example |
|---|---|---|
| Spatial | the level of detail or clarity of an image, defined by the size of the smallest object or feature that can be distinguished on the ground. | 30 m |
| Spectral | the number and width of the spectral bands that are captured by a sensor. | Band 4 - Red, Band 5 - Near Infrared (NIR), Band 6 - SWIR 1 |
| Temporal | the frequency at which images or data are collected over a given area. | daily |
| Radiometric | the sensitivity of a sensor to differences in the amount of energy reflected or emitted by a target. | an 8 bit sensor has values between 0 and 255 (256 possible values) |
1.2 Applications
There are many useful applications of remote sensing. Examples of agricultural applications include productivity increasing. This could be done by providing inputs, given from remote sensing data, for improvement of soil fertility. The other example is to identify culturable wastelands or marginal lands. The benefit of this application is to increase agricultural area (Navalgund, Jayaraman, and Roy 2007). Without remote sensing data, it will be difficult to retrieve data covering every area in the country.
Next, let’s look into more detail of some research using remote sensing.
- Soil fertility assessment for optimal agricultural use using remote sensing and GIS technologies (AbdelRahman, Hegab, and Yossif 2021)
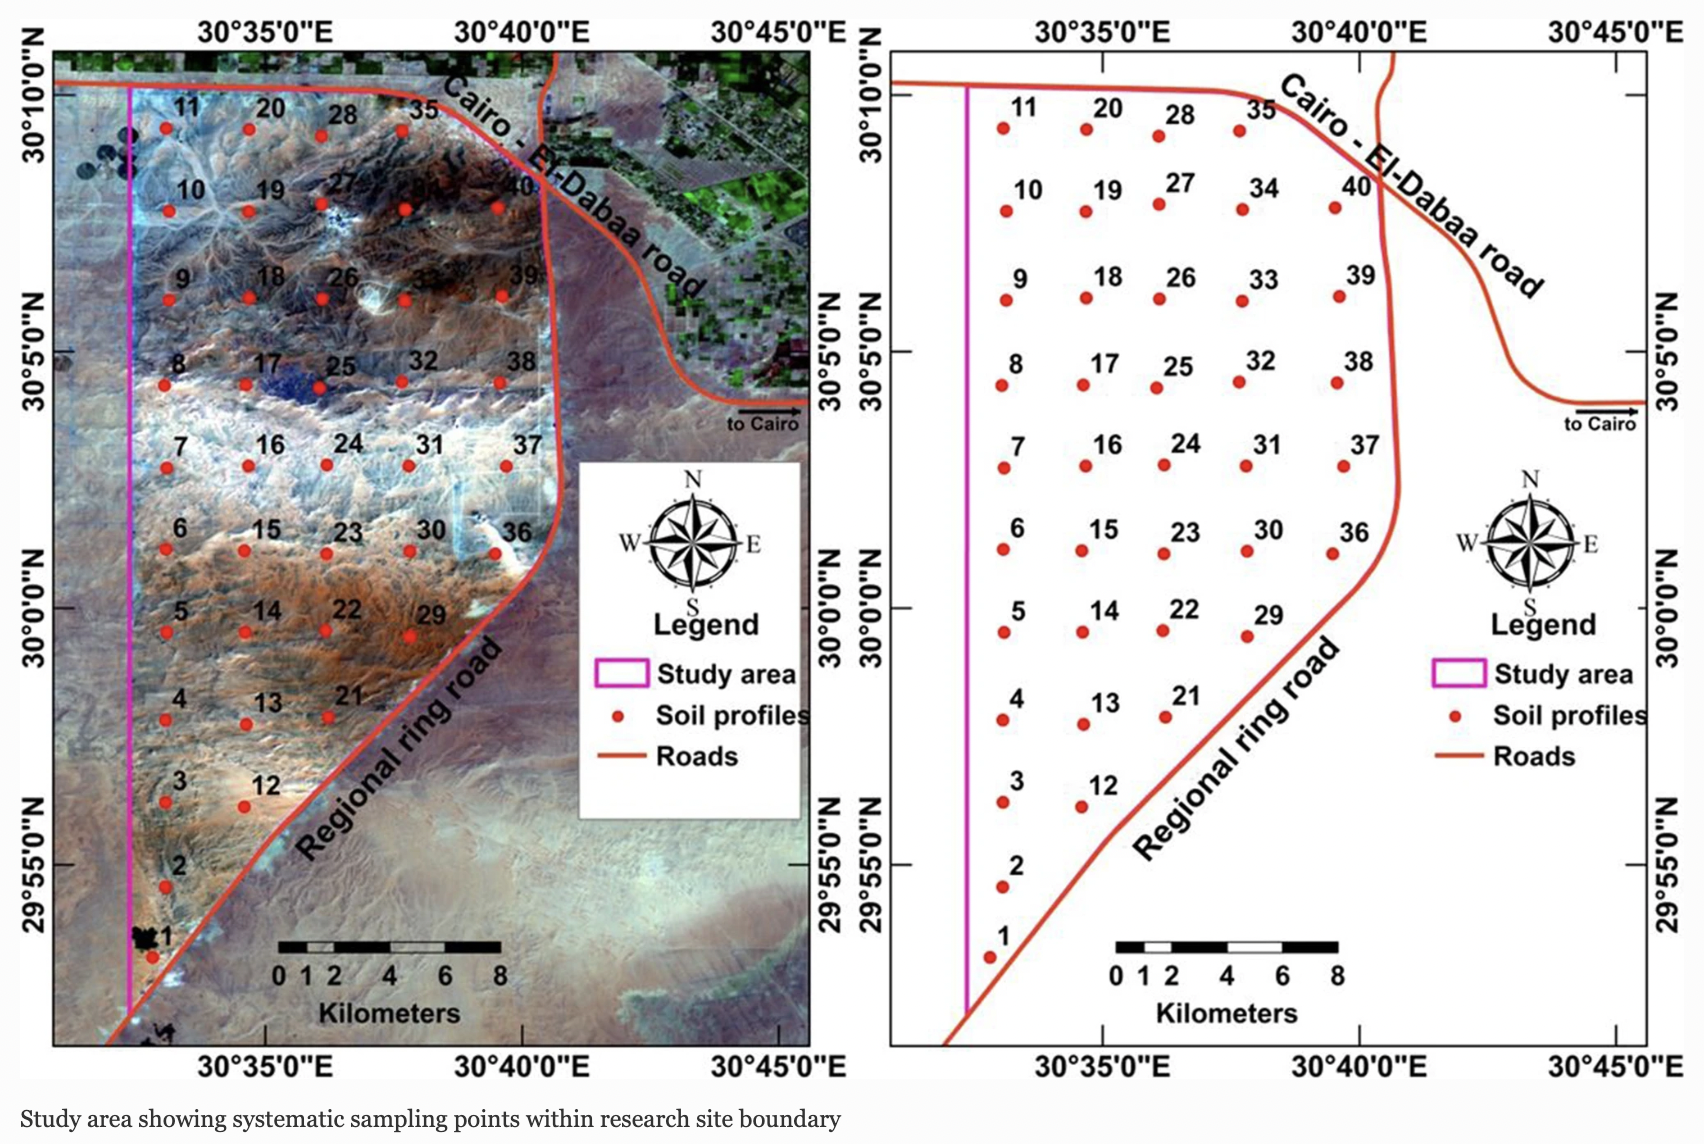
Summary: This research aims to assess soil fertility for optimal agricultural use in Egypt using remote sensing. The study area is located in the north region of the west desert. The goal is to determine the suitable areas for different crops and irrigation systems. The results show that the high suitable areas for barley and wheat were about 54.7%, while for corn and beans were about 44.9%. To reduce water losses, the study recommends improving the delivery and efficiency of irrigation systems and choosing appropriate irrigation methods.
Methodology: The researcher combined Sentinel-1 and DEM derived for conducting landform and soil mapping. Some indices related to soil were extracted from remote sensing data, such as soil fertility index (SFI) and soil evaluation factor (SEF). Ordinary kriging (OK) method was performed to predict unmeasured locations by incorporating spatial correlations. Soil capability was assessed by categorising into 3 classes from irrigation capability index.
Comments: This use case is quite impressive that they tried to use remote sensing data to help with soil assessment. It can be very tough if we do not have remote sensing data. However, this research mentioned that “Collected soil samples were analyzed according to USDA (2014). Soil taxonomy was produced using USDA (2014).” I wondered if the assessment of crops in Egypt can follow every guideline provided by the United States. The species of crops may different between country and have to adapt for some implementation.
1.3 Reflection
Content: As I used to work in the feed trading company before, remote sensing plays an important role of estimating crop supply. To identify the location of all crops such as corn and soybean in the country, we need to depend on remote sensing data to quickly estimate the supply of each crop. Otherwise, human are needed to survey in every fields, which is quite exhaustive. Furthermore, it is good to see the availability of data with different resolution, so we can choose and use it with a proper task.
Applications: The selected research looks very useful and be likely to be able to apply for a better agricultural use. However, there are so many methods mentioned in this research, such as Ordinary kriging (OK) that I have not learned before. I expect that after studying this course for a while and reading more researches, I can have a better understanding of the remote sensing research more.